A "200 QPS" benchmark that actually delivered 38
Google engineers found that published LLM inference benchmarks routinely misreport their own load: Python's GIL caps single-process harnesses well below the requested request rate, while they silently report the number you asked for. The fix they built, Inference Perf, adds client-side observability so teams can tell whether a slow result is their server or their benchmark tool.
- Speakers — Ashok Chandrasekar, staff software engineer at Google and maintainer of Inference Perf and LLMD benchmarking SIG lead, presented with Jason Kramberger, a Google software engineer and co-maintainer of Inference Perf.
- Benchmark landscape — They map four categories of existing tools: model-server scripts like VLM and SGLang, competitive tools like MLPerf, artificial analysis, and semi analysis, web-load tools like Locust, Grafana k6, and production-scale LLM benchmarks, which is their focus.
- Production complexity — An LLMD inference stack with prefill-decode disaggregation and workload autoscaling requires high load, realistic workloads, and metric fidelity that simple harnesses aren't built to deliver.
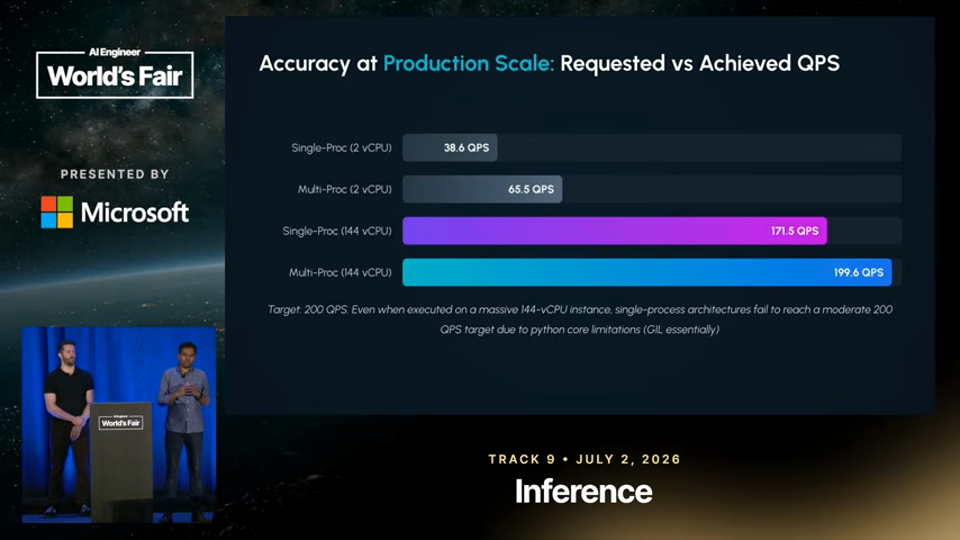
- The 200 QPS test — Asking a harness for 200 queries per second on a small machine returned only 38 QPS, and even on a bigger machine single-process harnesses capped near 170 QPS without reporting the shortfall.
- GIL bottleneck — Python's global interpreter lock makes single-process harnesses effectively CPU-bound and single-threaded, so they can't scale load even on multi-CPU machines.
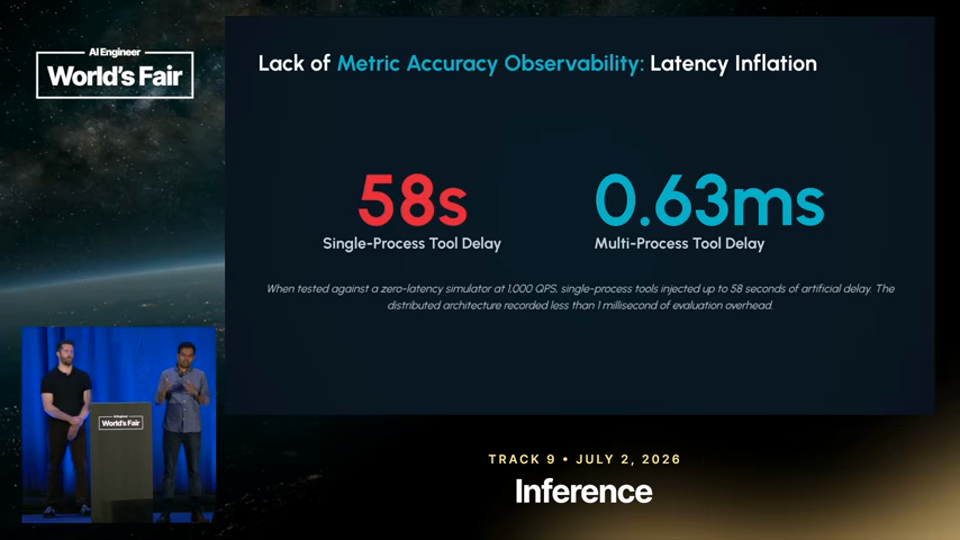
- Latency inflation — A thrashing single-process client inflated measured latency by up to 58 seconds against a simulated server that should have shown none, making a fine server look bottlenecked.
- Temperature trick — A shared result claiming 20% better throughput turned out to use temperature zero for deterministic, faster output, versus the roughly 0.7 typical of real workloads.
- Dataset drift — The same ShareGPT dataset fed to two different harnesses produced different input token counts because each sampled and truncated the data differently.
- Inference Perf fix — Inference Perf is a CNCF project spun out of the Kubernetes serving working group, using a main process that schedules requests via Poisson, constant-rate, or fixed-concurrency plans and fans them across worker processes.
- Scale test — Compared against tools like k6, Inference Perf kept up and correctly reported success at 5,000 queries per second.
- Configuration and catalog — Declarative configs support multi-turn conversation replay with length distributions, and a published workload catalog defines scenarios like tree of thought, agentic generation, and batch summarization.
- Prism results — On LLMD's Prism UI, an agentic code generation benchmark across eight TPU replicas showed combined optimizations scaling into the hundreds of thousands of tokens per second versus a plain Kubernetes-service baseline.
In their words
when you run with a really uh small shad core mission, you can see that even when you request 200 QPS, you are only getting 38 QPS and then you give it a bigger mission and then some of these uh single process harness they cap out at like 170 QPS5:49
in one of the tests we noticed like u the delay was up to 58 seconds. So you might look at this and go oh my server is bottlenecked right it's not able to handle all the requests but in fact it's actually your benchmark client that is inflating the latency6:38
they said, "Hey, we are getting 20% better throughput." Then we looked into it and we found out the benchmark harness were setting the model temperature to zero7:12
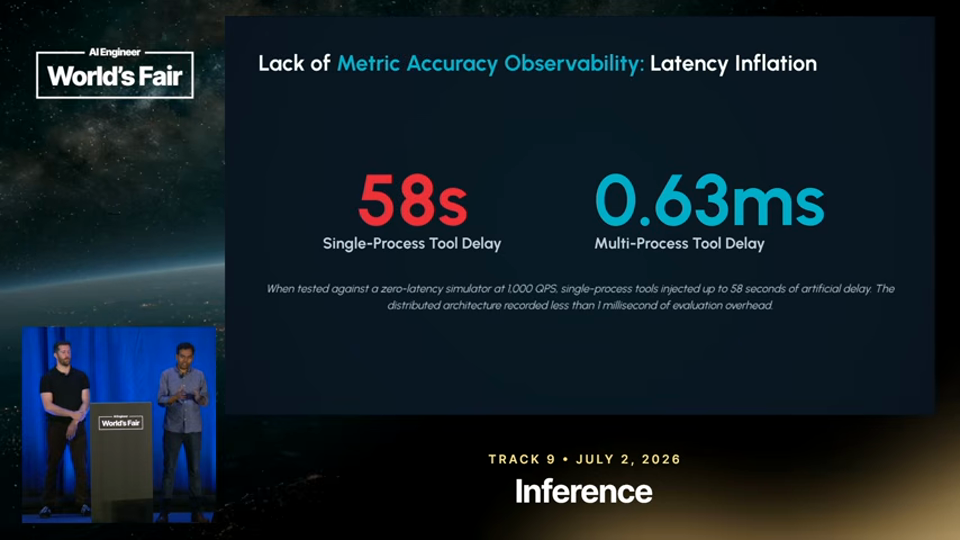
a lot of times you diagnose it as a your server or inference stack problem but in a lot of cases it could be your benchmark harness8:16
Disclosure · Both speakers are Google engineers presenting and promoting their own open-source projects, Inference Perf and LLMD (including its Prism UI and workload catalog), which are CNCF/Kubernetes ecosystem tools they maintain.
One thing to add — One thing to add — the talk is a strong argument for treating benchmark harnesses themselves as untrusted systems requiring their own telemetry, not just a footnote to server performance. It's worth noting the presented Inference Perf comparisons (e.g., the 5,000 QPS chart) come from the speakers' own tool versus unnamed competitors, so independent verification would strengthen the claims.</note> </invoke>
One thing to try tonight
If you run LLM inference benchmarks, check whether your harness is single-process Python and log the actual achieved QPS against the requested rate before trusting any throughput number it prints.